
How we can help you
Our services for pharmaceutical companies and research.
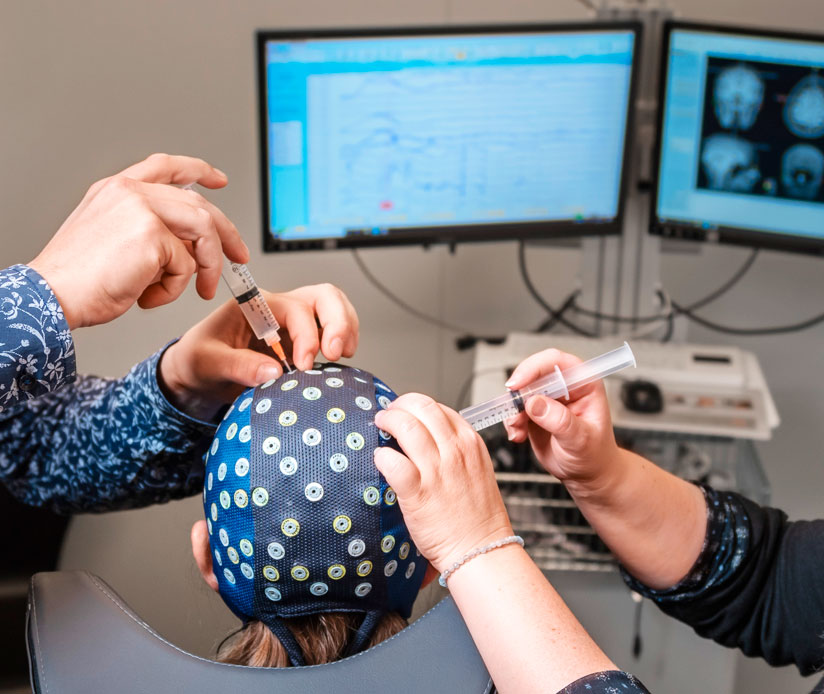
If you have a research project that uses EEG/ECG data, we offer everything that comes after raw data acquisition. Including cleaning, feature extraction and data analysis.
If you are a student or an educational center, you can access our academic license.
Research and Development
We handle all steps following raw data acquisition, including data cleaning, feature extraction, and analysis. This streamlined, cost-effective approach lets you focus on core development while we manage the EEG and ECG workflows. Our modular software platform integrates a portfolio of clinically validated and experimental markers, providing quick, reliable insights for R&D teams in the EU, CH, US, and worldwide.
Academic License
Our software, provided under an Academic License, offers a streamlined, assembly line–style workflow that is fast and Python-based. Each processing step is recorded in auditable metadata, ensuring complete traceability and reproducibility. By meeting ISO13485 standards, our platform offers the reliability and precision needed for robust research.
We have developed modular feature extraction software with a portfolio of clinically validated and experimental EEG and ECG markers.
If you are looking for specific features, we are looking forward to discussing them in detail. Our current flagship markers are the following: